Long analytical articles become easier to read when their structure reflects the reader’s questions rather than the order in which the research was performed. This sample page demonstrates a practical sequence and activates the article table of contents.
Start with the claim#
The opening should state the question, the principal finding, and the scope of the evidence. It should not reproduce the research diary. Readers need a map before they encounter methodological detail.
A useful introduction normally answers three questions:
- What is being investigated?
- What does the evidence broadly indicate?
- What qualification matters before interpreting the result?
Establish the evidence hierarchy#
Not every source or output deserves equal weight. The article should make its hierarchy visible through wording, placement, and captions.
| Evidence type | Best use | Common mistake |
|---|---|---|
| Primary series | Establishing the central trend | Treating measurement changes as real change |
| Subgroup results | Testing whether an average is representative | Showing too many groups without a clear comparison |
| Sensitivity checks | Testing robustness | Presenting every check as equally important |
| Contextual sources | Explaining mechanisms and history | Using context as a substitute for measurement |
Strong presentation does not make weak evidence stronger. It makes the strength and limitations of the evidence easier to judge.
Move from overview to detail#
A reader should encounter the broad pattern before the exceptions. The sequence below is deliberately editorial rather than computational.
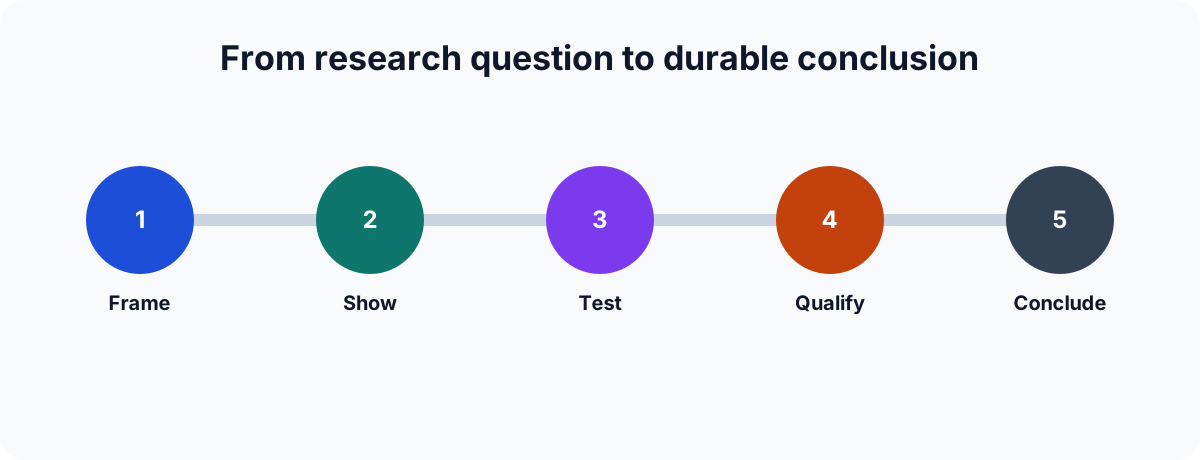
Frame the question#
Define the population, period, unit of analysis, and comparison. Ambiguity here propagates through every later section.
Show the central result#
Use the smallest number of figures needed to establish the main pattern. A chart earns space when it communicates something that prose or a compact table cannot communicate as effectively.
Test the interpretation#
Separate groups, change assumptions, or use an alternative measure when those checks can overturn the initial reading. Supporting analysis should answer a specific doubt rather than merely demonstrate that more calculations were performed.
State limitations where they matter#
A limitation belongs near the claim it constrains. Collecting every caveat in a final paragraph makes it easy for readers to miss which conclusions are affected.
Design for revision#
A static article is still malleable. Markdown keeps prose easy to edit, while page bundles keep article-specific figures together. Replacing timeline.svg does not require rewriting a template or changing a public notebook.
The simplest durable workflow is:
private analysis → exported figure → Markdown article → static build → GitHub PagesConclude at the correct level of certainty#
The conclusion should return to the initial question and state what the evidence supports—not merely repeat the most visually prominent chart. It should distinguish measured results from plausible explanations and identify the uncertainty most likely to change the interpretation.
That discipline is more important than any particular site generator. The framework exists to keep the publishing process simple enough that attention remains on the argument.