A rising average can summarize a dataset accurately while still concealing the change that matters most. This synthetic example demonstrates how an article can move from a compact overview to a wider comparison and then to two supporting views.
The aggregate view#
The headline series rises from an index value of 100 to 148 over eight periods. The direction is clear, but the line alone does not show whether every group moved together.
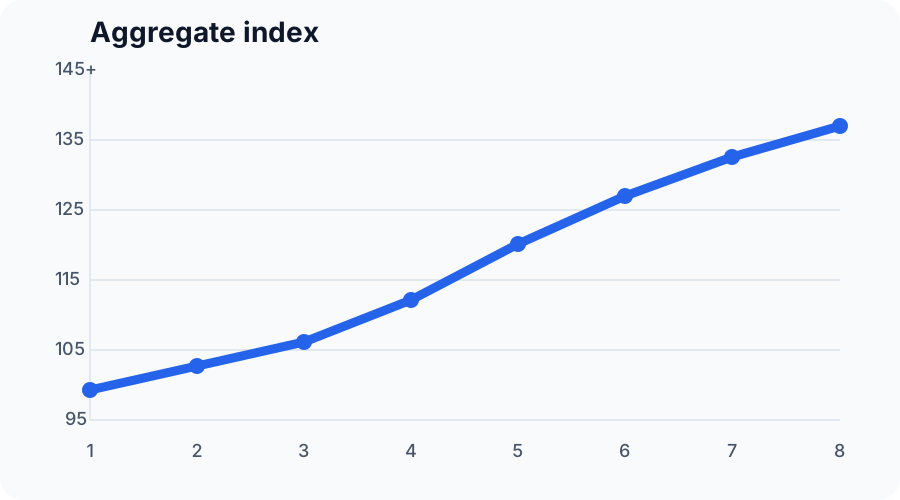
The change accelerates in the middle of the series and then moderates. That pattern is visible at ordinary article width, where the chart remains close to the paragraph that interprets it.
The group comparison#
A wider layout is more useful once the aggregate is separated into four groups.
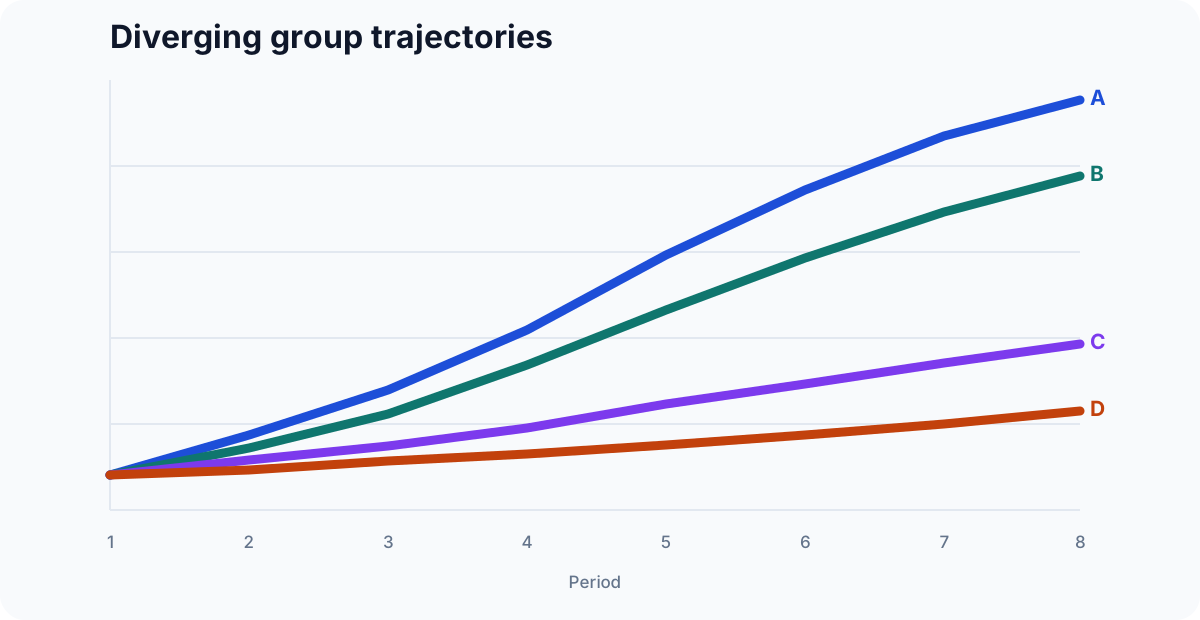
The wider figure makes two conclusions easier to see. First, the final gap between groups is much larger than the initial gap. Second, the aggregate line is not representative of the trajectory experienced by every group.
Level and change answer different questions#
The same result can be presented as final levels or as cumulative change from the baseline. Placing the two views beside each other makes the distinction explicit.
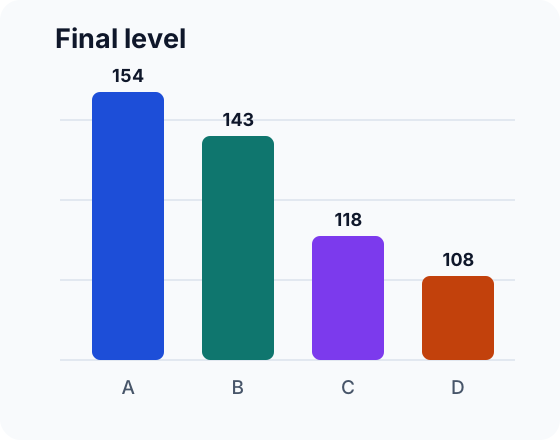
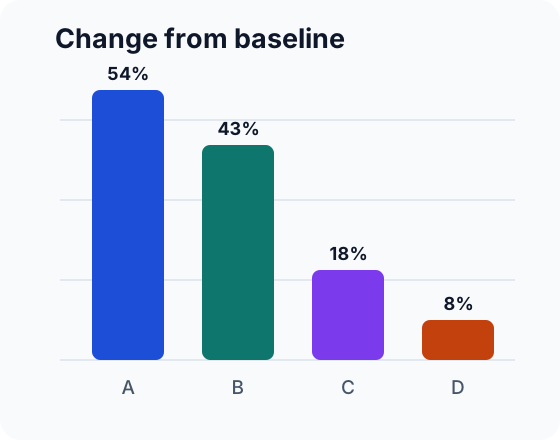
Group A finishes at the highest level, while Group B records nearly as much growth from a slightly lower starting point. Groups C and D appear similar in the final-level chart, but their growth rates are not identical.
What the layout contributes#
The article does not expose a notebook or follow its cell order. Each figure is an independent SVG asset, so the narrative determines placement:
- the overview remains close to the introduction;
- the dense comparison uses more horizontal space;
- the final two views share a common caption and collapse vertically on mobile.
This is the intended pattern for future analytical articles: compute privately, export deliberately, and write the public piece as an ordinary publication.